Crypto market structure
Contributo di F. Chinello
1. Introduction
A cryptocurrency (or crypto) is a digital currency that does not rely on any central authority to uphold or maintain it. The technology underlying cryptocurrencies is the blockchain. Essentially, a blockchain is a database shared over a network of computers called nodes. It is structured as a growing sequence of data blocks chained together cryptographically. Crypto transaction data are “packed” into blocks that are sequentially appended to the blockchain dataset. Each block is chained to the previous one using cryptography, and this guarantees the integrity of the data. Every blockchain protocol sets its own rules governing how “consensus” should be reached. By “consensus” we mean a general agreement on the state of the blockchain (Garavaglia, 2022). The most important types of consensus mechanism are proof-of-work and proof-of-stake. In proof-of-work blockchains, such as Bitcoin, you can append a block to the blockchain only if you have sorted out the right solution to a complex mathematical problem. In this way, you demonstrate that you have spent some computational work to build and append the block (“mining”). In proof-of-stake blockchains, such as Ethereum, you must hold a “stake” of the associated (“native”) cryptocurrency to append blocks to the blockchain.
In 2008, the first cryptocurrency, Bitcoin, was created. Bitcoin was introduced in the white paper Bitcoin: A Peer-to-Peer Electronic Cash System (Nakamoto, 2008). The true identity of Satoshi Nakamoto still today remains a mistery. In the following years, Bitcoin pioneered the boom of cryptocurrencies. According to CoinMarketCap, accessed on 2022-09-12, nowadays exist more than 20.9 thousand cryptos. The market cap of the entire crypto market is $1.02 trillion, less than the capitalization of a single company such as Apple ($2.54 trillion as of 2022-09-13) or Microsoft ($1.92 trillion as of 2022-09-13). To give an idea of the relevance of cryptocurrencies as opposed to others asset classes, as of 2021 the world bond market outstanding was $124.4 trillion, and the world stock market had a market capitalization of $126.9 trillion (Securities Industry and Financial Markets Association, 2022).
The first cryptocurrency by market cap is Bitcoin ($433.78 billion as of 2022-09-13), followed by Ethereum ($212.97 billion as of 2022-09-13). The combined Bitcoin and Ethereum capitalization roughly represents 60% of the overall crypto market.
Table 1 lists the 10 largest cryptocurrencies by market capitalization according to CryptoCompare, data downloaded on 2022-09-13. For each crypto, we report the symbol, the market capitalization expressed in US dollars, the type of consensus mechanism, and the launch date.
| Crypto | Symbol | Market cap. (bn) | Consensus mechanism | Launch date |
|---|---|---|---|---|
| Bitcoin | BTC | $433.78 | PoW | 2009-01-03 |
| Ether | ETH | $212.97 | PoS | 2015-07-30 |
| Tether | USDT | $67.79 | n.a. | 2014-10-06 |
| USD Coin | USDC | $51.49 | n.a. | 2018-10-31 |
| Binance Coin | BNB | $48.54 | PoSA | 2017-06-27 |
| Ripple | XRP | $35.64 | XRP LCP | 2013-01-01 |
| Solana | SOL | $20.37 | PoH | 2017-11-01 |
| Binance USD | BUSD | $20.16 | n.a. | 2019-09-10 |
| Cardano | ADA | $17.03 | PoS | 2017-10-05 |
| Polkadot | DOT | $9.75 | NPoS | 2020-08-18 |
PoW: Proof-of-Work
PoS: Proof-of-Stake
PoSA: Proof-of-Staked-Authority
NPoS: Nominated Proof-of-Stake
XRP LCP: XRP Ledger Consensus Protocol
PoH: Proof of History
2 Exploring Bitcoin
2.1 The Bitcoin network
As we have anticipated in the Introduction, the blockchain database is shared over a network of computers. In this subsection, we will explain in details how the Bitcoin network works. However, before doing so, we must clarify some basic concepts. Bitcoin, E-mail, and the World Wide Web are all Internet technologies based on a network of interconnected computers. These computers are called “nodes”. Within a network architecture, there are computers that provide some services (servers), and computers that request these services (clients)[1].
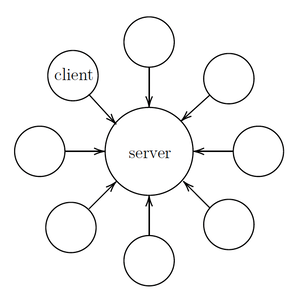
There is no single network architecture. In a centralized client-server model, there is a centralized (group of) server(s) providing services to clients. See Figure 1.
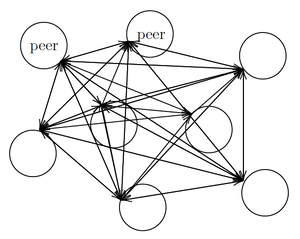
In a peer-to-peer (P2P) model, each node acts both as a server and as a client with respect to its peers. In a peer-to-peer model the nodes are all “equal” and contribute to deliver network services. See Figure 2.
The Bitcoin blockchain is a peer-to-peer network maintained by thousands of full nodes, i.e., nodes that download and sync the entire blockchain ledger or part of it (pruned nodes), and independently verify block and transaction data before transmitting it to other nodes[2]. Therefore, full nodes contribute to improve the security and decentralization of the network. Full nodes also serve lightweight nodes, i.e., nodes that store block headers only and rely on full nodes for retrieving everything else on demand (Bitcoin website, accessed on 2022-08-17). While full nodes drain a significant amount of computational power and disk space, lightweight nodes can also run on resource-constrained devices, such as smartphones.
Both full and lightweight nodes can include additional functionality, like a wallet. Wallets will be explained in Subsection 2.4. Furthermore, some nodes include the mining function, i.e., the capability of building blocks of transaction data and adding them to the blockchain database. These nodes are called “mining nodes” or “miners”. The mining activity will be explained in Subsection 2.2.
When a new transaction occurs, it is propagated from the originating node over the whole network. Before routing information to peers, each node performs a consistency check with the data already included in the blockchain. Nodes temporary store pending transactions in the so-called mempool, which is a sort of waiting room. Each node has its own mempool, and mempools are not perfectly synchronized across nodes.
2.2 Consensus mechanism
In the previous section we said that the Bitcoin system relies upon a network of computers, or nodes, which are all peers. These nodes distrust each other. How can distrustful network participants reach consensus about the state of the blockchain dataset? This is made possible by the adoption of a consensus mechanism. The consensus mechanism is the set of rules that governs how to reach a general agreement about the state of a blockchain database. Every blockchain has its own consensus mechanism. The type of consensus mechanism adopted by Bitcoin is called “proof-of-work” [3].
In Bitcoin’s proof-of-work, miners are required to spend some computational power to participate in a competition. The competition is articulated as a sequence of rounds. Each round consists in looking for a solution to a complex mathematical problem associated with a block of pending transactions. The solution to the mathematical problem is needed for appending the block to the blockchain. Therefore, miners do two things:
- build a block of transaction for each round of the competition;
- try to solve a mathematical puzzle associated with the block.
In case a miner is successful in a round of the competition, it broadcasts the solution to the network. According to Decker and Wattenhofer 2013, the median time for a peer to receive a block is 6.5 seconds, while the mean value is 12.6 seconds. After 40 seconds, 95% of the peers have received the block. Each peer verifies that the block’s transactions are legitimate, and the solution is correct. If this is the case, the block is appended to the blockchain, and the miner gets rewarded. All the other miners have lost a round of the competition. The following round immediately begins. Each miner starts building a new block and looking for a solution to the relative cryptographic puzzle.
By imposing some work to add a block to the blockchain, “proof-of-work” cryptos guarantee the security of the blockchain and prevent fraudulent behavior. First, miners are discouraged to cheat. If they do so, they will be spotted by their peers. In this scenario, the cheating miners will incur in a cost (the energy utilized to solve the mathematical problem) and won’t earn any revenue, as they won’t get the reward. Furthermore, to alter a transaction included in a block of the blockchain, you need to re-do the computational work associated with that block and with all the subsequent blocks in the blockchain sequence. Therefore, as new blocks are appended on the top of a certain block, altering the block’s transactions becomes more and more difficult. After some blocks, blockchain entries become almost immutable.
2.2.1 The blocks of pending transactions
Let’s explain how miners build blocks of pending transactions. To do that, they “pick” pending transactions from the mempool where they are stored, and “pack” them into blocks. They build a new block for each round of the competition. Block size is constrained to 4 million weight units, which are equivalent to a theoretical maximum capacity of 4 megabytes. The block space is not allocated according to a pre-defined rule, i.e., miners can discretionary choose which transactions to include in a block.
2.2.2. The mathematical puzzle
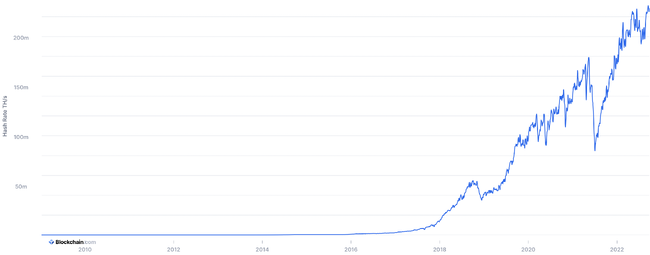
The difficulty of the mathematical problem is adjusted every 2016 blocks (approximately 2 weeks) so that on average a new block is mined every 10 minutes. Therefore, the larger the computing power engaged in solving the puzzles, the higher will be their difficulty. The total computing power absorbed by the mining activity is measured by the hash rate, which is the number of calculations per second the network can make. For example, if the hash rate is 10 Th/s (terahashes per second), this means that the network can make 10 trillion calculations per second (Bitcoin website, accessed on 2022-08-17). Figure 3 reports the estimeted total hash rate of the Bitcoin network from its origins to September 25, 2022 (Blockchain.com, accessed on 2022-09-26).
2.2.3 The reward
When a miner successfully mines a block, it obtains a reward. Since the reward is attributed with a transaction included in the block (“coinbase transaction”), the miner does not get rewarded in case of block rejection by its peers. For example, if a block contains a double-spending transaction, network nodes won't accept it and the coinbase transaction won't become part of the blockchain history. Therefore, all the transactions included in the block, including the coinbase transaction, won’t become part of the blockchain history. The reward comprises two components: a number of newly issued bitcoins and the fees associated with block transactions (Antonopoulos, 2017).
A number of newly issued bitcoins. This is the only way bitcoins are issued, i.e., every bitcoin is initially created as a mining reward. The number of newly-issued bitcoins per mined block, initially set to 50 in 2008, is halved every 210.000 blocks (approximately every 4 years). Currently, 6.25 new bitcoins are injected into circulation every time a new block is mined. The total Bitcoin supply is capped at 21m bitcoins, and this cap is expected to be reached in 2140. As of today, the circulating Bitcoin supply amounts to more than 19m bitcoins, i.e., more than 90% of the total Bitcoin supply has already been issued.
The fees associated with block transactions. Users pay fees to miners as an incentive to process their transactions. The fee amount is not predefined, and can be arbitrarly chosen by the transaction sender. As the space inside a block is limited and defined by the protocol, miners are expected to give higher priority to transactions carrying a larger fee/byte ratio.
2.2.4 Mining pools
In pool mining, miners work together to mine blocks. Pool participants share their computational power to solve proof-of-work puzzles. In case a solution is found, block rewards are split proportionally to each miner’s contributed computational power (Kent and Bain, 2022).
At the beginning of the Bitcoin history, the computational power of a personal computer was enough for participating in the mining competition. As Bitcoin’s popularity exploded, the network hash rate skyrocketed, leading to a tremendous increase in proof-of-work difficulty. Nowadays, running an individual mining business is energy and capital intensive. Massive investments in computer hardware (such as GPUs or ASICs) are required. In this scenario, mining pools give small players a way to enter the mining game, when their processing power is so low that individual mining isn’t practical (Kent and Bain, 2022).
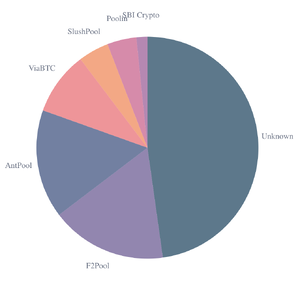
Mining pools increase the level of centralization of the network. For example, out of the 563 Bitcoin blocks mined between September 23-27, 2022: 95 were mined by F2Pool, 89 by AntPool, 52 by ViaBTC, 25 by SlushPool, 24 by Poolin, 9 by SBI Crypto. Figure 4 (Blockchain.com, accessed on 2022-09-26) shows an estimation of hashrate distribution amongst the largest mining pools for this period. Figure 5 represents how the hash rate distribution has changed between September 27, 2019 and September 27, 2022 (Blockchain.com, accessed on 2022-09-26).
2.2.5 Proof-of-work environmental issues and proof-of-stake
Proof-of-Work crypto mining drains a significant amount of energy and requires massive investments in computer hardware, thus generating carbon-dioxide emissions and electronic waste. An alternative and more environmental-friendly consensus mechanism is proof-of-stake (PoS). Ethereum, which is the most important blockchain together with Bitcoin trasitioned from proof-of-work to proof-of-stake on September 15, 2022. The adoption of proof-of-stake was expected to reduce Ethereum’s carbon-dioxide emissions by 99.95% (Ethereum website, accessed on 2022-08-17). In proof-of-stake, validating nodes (equivalent to mining nodes in PoW) stake some capital and put it at risk of being eroded or even completely destroyed in case they act dishonestly or lazily (e.g., proposing a block that contains a double spending transaction). In the Ethereum PoS implementation, users willing to participate as validators are required to commit 32ETH (more than $54 thousand as of 09-09-2022) as a guarantee, or collateral. In proof-of-stake, there is no cryptographic contest, and the validator in charge of proposing a new block is randomly selected. In addition to randomness, the selection process may factor in additional elements, such as the amount and the age of the stake (Kent and Bain, 2022).
2.3 Forks
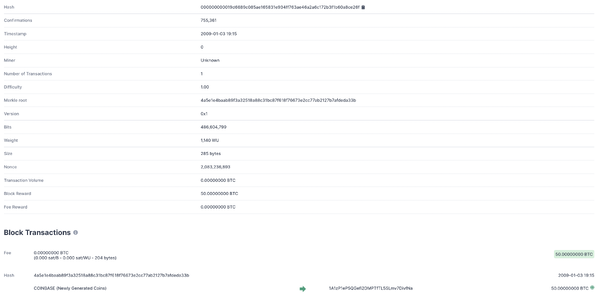
In a blockchain, a block is associated with a specific “height”, i.e., a number in the numbered succession of blocks that constitutes the blockchain. In other words, if a block is the block of the blockchain sequence (with starting from 0), its height will be . The first block ever created is called “genesis block” and has a height of 0. In the Bitcoin blockchain, the genesis block was created back in 2009 by Satoshi Nakamoto, and contains the coinbase transaction by which the first bitcoins where created (at the time 50 new bitcoins were issued per mined block). Figure 6 shows the Bitcoin genesis block as documented by Blockchain.com, accessed on 2022-09-26.
In a physiological setting, each block should be uniquely identified by its height, as only one block at the time should be appended to the blockchain. However, it could be happen that two blocks are added on the top of the blockchain at the same height. This scenario is known as “fork”, as the blockchain series splits in two branches. Forks can be accidental or intentional (Wikipedia, accessed on 2022-09-23).
For example, an accidental fork could happen when two miners mine a block nearly at the same time. In this case, only one of the two blocks will “survive”, while the other will be abandoned (“orphaned block”). As consensus rules establish that the longest chain always prevails, the surviving block is the one on the top of which the following blocks will be sequentially appended. All the transactions contained in the orphaned block, and not in the surviving block, are reverted to the “pending” status and returned to the mempool (Antonopoulos, Andreas M., 2018). These transactions will become part of the blockchain history as soon as they will be included in a valid block.
Intentional forks are caused by changes to consensus rules, and can be classified in “soft forks” and “hard forks”.
A soft fork results from a tightening of consensus rules. As the new rules are more restrictive than the old rules, blocks that are created according to the new rules are accepted by all nodes, even by those following the old rules. On the contrary, blocks created according to the old rules may be rejected by nodes following the new rules. Let’s make an example. If the maximum block size is 4MB, and we want to reduce this limit to 1MB, we are making consensus rules more restrictive. A 0.9MB block will be accepted by both nodes enforcing the old and the new rules, but a 1.2MB block will be recognized as valid only by nodes enforcing the old rules. As the adoption of the new rules increases, not-upgraded miners realize that their blocks are getting rejected and are incentivized to upgrade to the new rules.
A hard fork happens when consensus rules are relaxed. As the new rules are less restrictive than the old rules, blocks created according to the new rules may be rejected by nodes enforcing the old rules. For example, if the maximum block size, which was 4MB according to the old rules, is increased to 10MB, a new-rule compliant 5MB block will be rejected as invalid by nodes enforcing the old rules. If there is not unanimous consent about upgrading to the new rules, this causes a permanent split of the original blockchain in two distinct blockchains (Acheson, Noelle, 2022). As a hard fork creates two parallel blockchains, it also results in two separate native cryptocurrencies. For example, Bitcoin Cash is a spin-off crypto deriving from a hard fork of Bitcoin that took place in 2017. Since the two blockchains share the same transaction history up to the fork point, users holding a positive balance of the original crypto, are also entitled an identical balance of the spin-off crypto after a fork takes place (Binance academy, 2022). For example, a user holding 5 original coins before a fork, ends up with 5 original coins and 5 spin-off coins after the fork. As spin-off cryptos are powered by separate blockchains, with specific rules and characteristics, their price diverges from the one of the “parent” crypto. For example, as of September 23, 2022 the prices of Bitcoin and Bitcoin Cash were $18,698 and $113.64 respectively.
2.4 Transactions
In this Subsection we explain how Bitcoin transactions work through simple examples.
2.4.1 Keys and addresses
Alice wants to enter the Bitcoin world, but she has no idea where to begin. The first thing Alice should do is generating a private key, a public key, and one or more addresses. These alphanumeric strings allow Alice to send and receive bitcoins.
The private key (e.g. 3aba4162c7251c891207...) allows Alice to “unlock” and spend her bitcoin funds. By using the private key, Alice can prove the ownership of her bitcoins. The private key must be kept secret and stored safely. Anyone having access to Alice’s private key can irreversibly spend her funds. Furthermore, Alice cannot spend her bitcoins if she loses her private key.
The public key (e.g. 045c0de3b9c8ab18dd04...) and the associated address(es) (e.g. 1thMirt546nngXqyPEz532S8fLwbozud8) allow other users to transfer funds to Alice. Bob is a friend of Alice and wants to send her some bitcoins. To do so, Bob can transfer bitcoins to Alice’s public key or to one of her addresses. Bitcoin users typically send funds to addresses, and not public keys.
There are several tools for generating a private key, a public key, and an address. Alice decides to use one of these tools named BitAddress. She connects to the web page and gets a pair of keys (public and private) and an address in a few clicks. Furthermore, BitAddress allows Alice to generate additional addresses associated to the same public key (Garavaglia, 2022).
Let’s explain how BitAddress generates Alice’s keys and addresses.
First, BitAddress creates Alice’s private key. The private key is simply a number, picked at random. Alice’s private key, in hexadecimal format[4], is:
3aba4162c7251c891207b747840551a71939b0de081f85c4e44cf7c13e41daa6
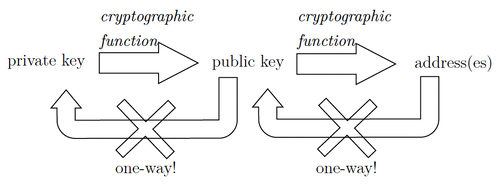
Secoond, BitAddress generates Alice’s public key by applying a one-way cryptographic function to the private key. “One-way” means that given the function y = f(x), it is possible to derive y from x, but not x from y. Thus, sharing the public key with other users is not risky as the cryptographic function cannot be reversed-engineered to obtain the private key. Alice’s public key, in hexadecimal format, is:
045c0de3b9c8ab18dd04e3511243ec2952002dbfadc864b9628910169d9b9b00bcefdd4347074d44bd7356d6a53c495737dd96295e2a9374bf5f02ebfc176
Lastly, BitAddress generates one or more addresses from Alice’s public key by applying a one-way cryptographic function. The address(es) are derived from the public key, but it is not possible to derive the public key from the address(es) (“one-way”). (One of) Alice’s address(es) is:
1thMirt546nngXqyPEz532S8fLwbozud8
Figure 7 summarizes the derivation relationships between the private key, the public key, and the addresses.
2.4.2 Wallets
A wallet is a device, physical medium, program or service that is used to store the pair of keys and the address(es). The simplest example of wallet is a sheet of paper (paper wallet, see Figure 8).
The paper wallet in Figure 8 reports the private key (on the right) and the Bitcoin address (on the left). The information is provided both in string and QR code format. A QR code is a type of bar-code that can be scanned using a smartphone camera. QR codes provide a more agile way to copy the private key and the address from the paper wallet to a mobile device.
There are many types of wallets, beside paper wallets: desktop wallets (installed on a personal computer), mobile wallets (running on a smartphone), web wallets (accessed through a web browser), hardware wallets (specific tech devices). You can try several wallets and choose your favorite one (Antonopoulos, 2017).
Notice that a wallet stores keys and addresses. You cannot store bitcoins in a wallet, as you cannot hold bitcoins in a “physical” sense. Your bitcoin balance, which is associated with your keys, is derived from the blockchain transaction history.
2.4.3 Where to buy bitcoins?
Alice has set up a wallet but she doesn’t know where to buy bitcoins. Several options are available (Antonopoulos, 2017):
- she could buy bitcoins on a crypto exchange and pay in local currency;
- she could ask Bob to sell her bitcoins in exchange for cash;
- she could sell some products or services, and accept payments in bitcoins;
- she could use a Bitcoin Automated Teller Machine (ATM), that allows users convert cash in bitcoins.
2.4.4 How to transfer bitcoins?
Alice wants to transfer bitcoins to her friend, Bob. To do that, Alice:
- opens her mobile wallet;
- imports Bob’s address by scanning a QR code generated by Bob’s mobile wallet;
- selects the amount to be transferred;
- taps on transfer.
As Alice taps on transfer, the wallet structures the transaction and sends it to the network.
Let’s explain the technical structure of a Bitcoin transfer. First, we must clarify the concepts of “transaction inputs” and “transaction outputs”. Bitcoin transactions consummate bitcoins owned by the transferor (transaction inputs) and generate bitcoin amounts entitled to the receiver(s) (transaction outputs). When you transfer bitcoins, the transaction inputs must be the outputs of a previous transaction you have received and not spent yet (Unspent Transaction Outputs, UTXOs). As we have explained in 2.4.1 Keys and addresses:
- the private key is needed for “unlocking” and spending your bitcoin funds, i.e., for using UTXOs as inputs in a new transaction;
- the public key and the address(es) are needed for entitling to the desired recipient(s) the transferred funds, i.e., the transaction outputs.
The following example will clarify the relationship between transaction inputs and outputs. Alice (address 1thMir...) transfers Bob (address 1A1zP1...) 0.02 BTC. The corresponding (simplified) blockchain entry will be:
FROM address 1thMir... 0.02 BTC
transaction input
= output of a previous transaction in which Alice acted as receiver
TO address 1A1zP1... 0.02 BTC
transaction output
Bob (address 1A1zP1...) decides to transfer Carla (address 1Hu13C...) the 0.02 BTC he has received from Alice. The corresponding (simplified) blockchain entry will be:
FROM address 1A1zP1... 0.02 BTC
transaction input
= output of “Alice-to-Bob” transaction
TO address 1Hu13C... 0.02 BTC
transaction output
Let’s consider a real transaction such as the one reported in Figure 9.
This transfer uses a single input, which is reported on the left-hand side of the arrow. It is a UTXO of 5.80037078 BTC. You can read the transferor’s address (bc1qtc...) next to the input amount.
The outputs are recorded on the right-hand side of the arrow:
- a payment of 0.00258250 BTC is sent to address
24HKEt... - a “residual” of 5.79756643 BTC is sent back to the transferor’s address (
bc1qtc...)
The total input amount is slightly higher than the total output amount; the difference is a fee paid to the miner that will include the transaction in the blockchain. See Subsection 2.2 Consensus mechanism for further details.
total inputs = 5.80037078 BTC
total outputs = 0.00258250 BTC + 5.79756643 BTC = 5.80014893 BTC
fee = 5.80037078 BTC - 5.80014893 BTC = 0.00022185 BTC
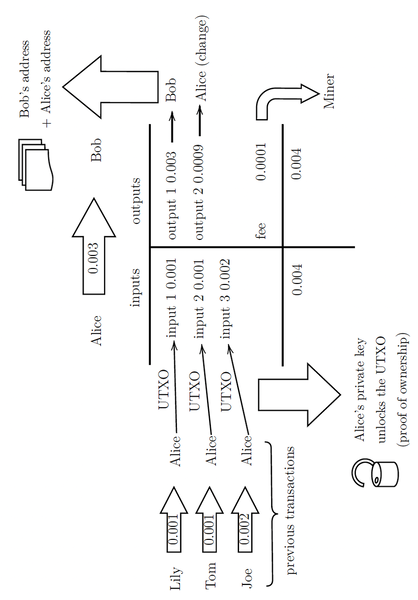
Figure 10 provides a further example of a Bitcoin transaction. Let’s assume that Alice received bitcoins separately from Lily, Tom and Joe (0.001 BTC, 0.001 BTC, 0.002 BTC). Now, she wants to send Bob 0.003 BTC. With her private key, Alice unlocks the unspent outputs of the three previous transactions. These UTXOs become the inputs of the new transaction addressed to Bob, which in turn generates two new outputs (0.003 BTC to Bob, 0.0009 BTC back to Alice as a “residual”). The fee to the miner is 0.0001 BTC.
3. Cryptocurrency exchanges
As for traditional financial securities, cryptocurrencies can be traded on exchanges, which are marketplaces that bring together multiple buying and selling interests. Crypto exchanges allow users to trade one crypto for another (e.g. BTC/ETH), and/or a crypto for a national (fiat) currency (e.g., BTC/USD). A large number of exchanges, mostly unregulated, is active in the crypto space. There are two key types of crypto exchanges: centralized exchanges (CEXs) and decentralized exchanges (DEXs).
Centralized exchanges (e.g. Coinbase) are very similar to traditional exchanges for financial securities. They aggregate multiple buying and selling interests in a centralized register, the Limit Order Book (LOB). A matching engine determines which orders can be fully or partially executed based on the state of the LOB. In centralized exchanges, the exchange services are provided by a firm, e.g., Coinbase Global Inc.
Decentralized exchanges (e.g. Uniswap) act as “vending machines”, providing agents with the possibility to trade without the need for a firm such as Coinbase to manage the process. The building blocks of these “vending machines” are smart contracts, which are pieces of code running on a blockchain. The largest and most important decentralized exchanges adopt a different liquidity provision mechanism as compared to traditional exchanges for financial securities and centralized crypto exchanges. This liquidity provision mechanism is called Automated Market Maker (AMM) and will be discussed in Section 3.2.
3.1 Centralized exchanges
3.1.1 Overview of centralized market
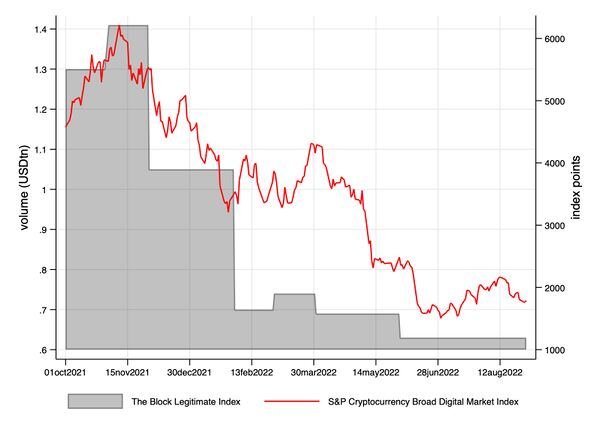
According to The Block website, accessed on 2022-09-01, in the first eight months of 2022 $5.69 trillion were traded on the largest and most reliable centralized spot exchanges for cryptocurrencies. This figure was $9.72 trillion in the same period of the previous year, showing a 41.46% year-to-year decline. The drop in the trading activity follows a simultaneous bearish tendency in the crypto space.
Figure 11 shows the time-series dynamic of The Block Legitimate Index (The Block website, accessed on 2022-09-01) and S&P Cryptocurrency Broad Digital Market Index (S&P Dow Jones Indices website, accessed on 2022-09-13) from October 2021 to August 2022. The Block Legitimate Index reports the volume traded on the largest and most reliable centralized spot exchanges for cryptocurrencies (monthly frequency). The S&P Cryptocurrency Broad Digital Market Index is a price index covering a broad universe of cryptocurrencies (daily frequency).
The cryptocurrency markets are highly fragmented, with hundreds of exchanges spread all over the world, and high regulatory heterogeneity (Kaiko Indices, 2022). CoinMarketCap, accessed on 2022-09-01, reports 288 centralized spot exchanges for cryptocurrencies.
Crypto exchanges should not be ranked according to reported trading volume, as previous literature has demonstrated the existence of wash trading and market manipulation in some cryptocurrency markets (Cong et al., 2021). Furthermore, when evaluating the quality of crypto exchanges, additional metrics beyond liquidity should be taken into account. Therefore, in Table 2 we report the 10 best-ranked centralized exchanges according to their Kaiko Exchange Score (Kaiko website, accessed on 202208-30). This score is based on a proprietary methodology developed and maintained by Kaiko, which is a leading crypto data provider. It takes into account six areas: governance[5], business maturity and quality, technology, data quality, security, and liquidity (Kaiko Indices, 2022). In addition to the Kaiko score, Table 2 reports for each exchange: the average daily trading volume for the period January - August 2022 (CryptoCompare, data downloaded on 2022-09-01), the number of listed coins, and the number of trading pairs (CoinMarketCap, accessed on 2022-09-01). The number of trading pairs is larger than the number of listed coins because a single crypto (e.g. BTC) may be traded against different fiat or crypto currencies (e.g. BTC/USD, BTC/ETH...).
| Exchange | Kaiko Exchange Score | Average daily volume Jan - Aug 2022 (mln) | Markets | Coins |
|---|---|---|---|---|
| Coinbase | 93 | $2,535.62 | 594 | 218 |
| Binance | 86 | $15,186.85 | 1702 | 387 |
| Kraken | 86 | $810.32 | 619 | 205 |
| FTX US | 84 | $208.14 | 55 | 29 |
| Gemini | 83 | $127.19 | 133 | 109 |
| ItBit | 82 | $20.04 | ||
| Bitstamp | 82 | $227.53 | 157 | 66 |
| CEX.IO | 81 | $17.04 | ||
| FTX | 80 | $2,018.12 | 424 | 286 |
| Huobi | 78 | $1,484.65 | 1087 | 595 |
Binance is the largest centralized spot exchange for cryptocurrencies by average daily trading volume ($15,186.85mln) and number of trading pairs (1702). Coinbase is the best-ranked exchange based on the Kaiko Exchange Score (93). As compared to Binance, Coinbase displays a significantly lower average daily trading volume ($2,535.6mln).
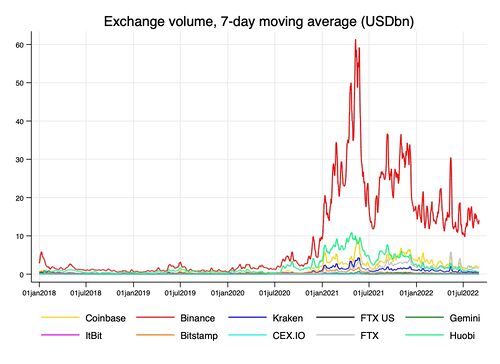
Figure 12 shows the time-series dynamic of the daily dollar volume traded on the exchanges presented in Table 1 for the period January 2018 - August 2022.
3.1.2 Trading hours
Traditional stock exchanges are open over a limited number of hours each day. Furthermore, they are closed during the week-ends and during holidays. On the contrary, centralized crypto exchanges[6] are open 24/24 and 7/7, even if liquidity shows diurnal patterns. Aleti and Mizrach, 2021 study BTC/USD trading on four centralized exchanges (Bitstamp, Coinbase, Kraken and itBit). They find that liquidity is lower when Bitcoin futures are not traded on the Chicago Mercantile Exchange. Furthermore, the authors document that liquidity generally peaks when the US and London markets are both open.
3.1.3 Order types and options
The order types and options available on centralized spot exchanges for cryptocurrencies are typically comparable with the ones that can be accessed on traditional exchanges for financial securities.
Table 3 shows the order types and options available on the 10 best-ranked exchanges according to the Kaiko Exchange Score.
| Exchange | Order types | Post only (limit orders) | Time-in-force (limit orders) |
|---|---|---|---|
| Coinbase | market, limit, stop limit | yes | GTC, IOC, FOK, GTT |
| Binance | market, limit, stop loss, stop limit, take profit,
take profit limit, trailing stop, trailing stop limit |
yes | GTC, IOC, FOK |
| Kraken | market, limit, stop loss, take profit, stop loss limit,
take profit limit, settle position |
yes | GTC, IOC, GTD |
| FTX US | market, limit, stop loss, stop loss limit, trailing stop,
take profit, take profit limit, TWAP |
yes | GTC, IOC |
| Gemini | market, limit, stop limit | yes | GTC, IOC, FOK |
| Itbit | market, limit | yes | GTD, IOC |
| Bitstamp | market, limit, instant, stop, trailing stop | yes | GTC, IOC, FOK, GTD, day |
| CEX.IO | market, limit, stop, stop limit | GTC, IOC, GTD | |
| FTX | market, limit, stop loss, stop loss limit, trailing stop,
take profit, take profit limit, TWAP |
yes | GTC, IOC |
| Huobi | market, limit, stop limit, trigger limit, trigger market,
trailing stop limit, trailing stop |
yes | GTC, IOC, FOK |
GTC: good-’til-cancelled
IOC: immediate-or-cancel
GDT: good-’til-date
FOK: fill-or-kill
GTT: good-’til-time
3.1.4 Trading parameters
Centralized crypto exchanges allow users to trade fractional units of a coin, and the minimum order size varies depending on the base cryptocurrency. The base cryptocurrency is the left currency in a pair, e.g. BTC in the pair BTC/USD. For example, Binance sets the minimum order size for Bitcoin to 0.00001 BTC (1/100,000).
In addition to the minimum order size, another key trading parameter is the maximum volume precision, i.e. the maximum number of decimal digits a user can entry when setting the order size. As the minimum order size, the maximum volume precision depends on the base cryptocurrency. For example, the maximum volume precision on Gemini is 8 decimals, i.e. 0.00000001 BTC. This means that you can set the order size to 0.12345678 BTC, but not to 0.123456789 BTC.
Similarly to the maximum volume precision, the maximum price precision (tick size) represents the maximum number of decimal digits a user can entry when setting the order price. For example, Coinbase sets the tick size for the BTC/USD pair at $0.01. If the tick size is, for example, $0.1, you can buy or sell Bitcoin at $19,972.2 or $19,972.3, but not at $19,972.25.
Table 4 shows the trading parameters set by the 10 best-ranked exchanges according to the Kaiko Exchange Score.
| Exchange | Minimum tradable quantity for BTC pairs | Minimum tradable value for BTC pairs | *Tick size BTC/USD |
|---|---|---|---|
| Coinbase | n.d. | 1 USD | 0.01 USD |
| Binance | 0.00001 BTC | 10 USDT | 0.01 USDT |
| Kraken | 0.0001 BTC | 1 USD | 0.1 USD |
| FTX US | *0.0001 BTC | n.d. | 1 USD |
| Gemini | 0.00001 BTC | n.d. | 0.01 USD |
| Itbit | n.d. | n.d. | 0.01 USD |
| Bitstamp | n.d. | 10 USD | 1 USD |
| CEX.IO | 0.00035981 BTC | 10 USD | 0.1 USD |
| FTX | *0.0001 BTC | n.d. | 1 USD |
| Huobi | 0.0001 BTC | 1 USDT | 0.01 USDT |
* If the BTC/USD pair is not available, we consider a pair in which BTC is traded against Tether (a USD stablecoin).
3.1.5 Fee schedule
Centralized crypto exchanges typically adopt a complex fee schedule.
Fees are expressed as a percentage of the total order value and depend whether the order is supplying or taking liquidity. A maker order is not immediately executed and is parked in the order book waiting for a match. Therefore, maker orders add liquidity to the market. Consider for example a limit buy order with $10 limit while the best ask is $11. A taker order gets immediately executed and takes away liquidity from the order book. For example, a market order is a taker order. As maker orders enhance liquidity, centralized crypto exchanges generally charge a lower fee to maker orders as compared to taker orders.
Centralized crypto exchanges typically classify users in tiers based on their 30-day trading volume and charge different fees for each tier. A higher trading activity will result in lower fees. Some exchanges having an exchange token discriminate users based on both the 30-day trading volume and the balance held in the exchange token. This approach is adopted for example by Binance (whose exchange token is BNB).
Table 5 summarizes the fee regimes adopted by the 10 best-ranked exchanges according to the Kaiko Exchange Score.
| Exchange | Maker-taker | Taker-maker | Positive fee | Hybrid |
|---|---|---|---|---|
| Coinbase | X | |||
| Binance | X | |||
| Kraken | X | |||
| FTX US | X | |||
| Gemini | X | |||
| Itbit | X | |||
| Bitstamp | X | |||
| CEX.IO | X | |||
| FTX | X | |||
| Huobi | X |
Maker-taker: rebate on limit orders and positive fee on market orders
Taker-maker: rebate on market orders and positive fee on limit orders
Positive fee: positive fee on both limit and market orders
Hybrid: both positive fee and maker-taker depending on the user’s 30-day traded volume
3.1.6 Call auctions
Centralized spot exchanges for cryptocurrencies typically do not conduct call auctions, as traditional stock exchanges generally do following a pre-defined daily schedule (e.g., opening/closing auction) and/or when the market is particularly volatile (volatility auctions). However, some exchanges, such as Coinbase and Huobi, conduct a call auction when support for new crypto/trading pairs is added.
3.1.7 Price protection mechanism
Some centralized crypto exchanges adopt a price protection mechanism, which restricts the usage of market and/or limit orders to manage market volatility. For example, Kraken cancels any market order when the spread becomes extremely wide (5-20% of the market price, depending on the currency pair). Some exchanges, such as Coinbase, allow market and limit order execution only inside a channel defined by price protection boundaries. Market and limit orders can be filled at prices inside the channel. Any residual quantity that would be filled at prices outside the channel, is cancelled.
3.1.8 Transparency
Centralized crypto exchanges typically provide users with real time data feeds at no cost, such as trade data (trade price, volume, and direction), Level1 order book data (top-of-the-book bid/ask prices and quantities), and Level2 order book data. Depending on the exchange, Level2 order book data can provide bid/ask prices and quantities for a limited number of price levels, or for the entire order book. Some exchanges also offer a Level3 data feed, i.e., they stream the full disaggregated order flow.
Table 6 reports the data feeds made available by the 10 best-ranked exchanges according to the Kaiko Exchange Score.
| Exchange | Trade data | Level 1 data | Level 2 data | Level 3 data |
|---|---|---|---|---|
| Coinbase | X | X | full book | X |
| Binance | X | X | 20 levels | |
| Kraken | X | X | 1000 levels | |
| FTX US | X | X | 100 orders | |
| Gemini | X | X | full book | |
| Itbit | X | X | full book | |
| Bitstamp | X | X | full book | X |
| CEX.IO | X | X | full book | |
| FTX | X | X | 100 orders | |
| Huobi | X | X | 150 levels |
3.1.9 High frequency trading
Aleti and Mizrach, 2021 study the HFT activity on Coinbase and Bitstamp using Level3 data for the period from January 2 to February 28, 2019. They compute the percentage of limit orders executed within 50 milliseconds as a proxy of aggressive HFT activity. This indicator is available for Coinbase only. In the analysis period, the average daily share of aggressive HFT executions on Coinbase was 2.51%. As a term of comparison, the same measure for AAPL stock on NASDAQ in January 2019 was 30.19%. Furthermore, the authors compute the number of orders cancelled before execution on Coinbase and Bitstamp. In the analysis period, the average cancellation to execution ratio was 36.90 on Coinbase and 50.27 on Bitstamp. As a term of comparison, the authors report that in the first two month of 2019 the same measure for the top capitalization decile of US stocks was 22.37, and for the top quartile of exchange traded products was 75.64.
3.1.10 API trading
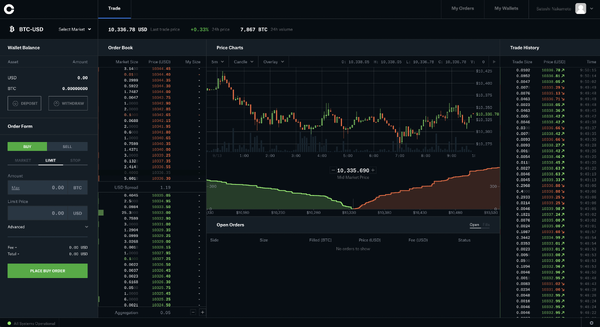
Centralized crypto exchanges typically allow users (even the retail ones) to directly access the market without the need of an intermediary or broker. This is not the case for traditional stock exchanges, where the privilege of trading directly on the exchange’s platforms is limited to member firms (retail investors are excluded). Crypto traders typically access centralized exchanges via intuitive graphical interfaces (see Figure 13). A graphical interface allows humans to interact with a piece of computer software through buttons, check boxes, and other visual elements.
Furthermore, many centralized crypto exchanges offer API (Application Programming Interface) trading. APIs are interfaces that allow a piece of computer software (e.g., the exchange’s system) to communicate with another piece of computer software (e.g., an algorithmic trading program). An API acts as an “intermediary” between two unrelated applications. By using APIs, even a retail investor with minimum programming skills can build his own algorithmic trading application. An example of algorithmic trading application is a Python code that:
- receives a real-time market data feed from the exchange (via API);
- processes the data feed to determine investment decisions;
- implements the investment decisions by submitting orders to the exchange (via API).
API trading is available to retail investors even outside the cryptocurrency world. For example, several retail brokers allow clients to algorithmically trade stocks via API. However, in this case the API product is offered to retail clients by brokers, and not by stock exchanges.
3.2 Decentralized exchanges
3.2.1 Decentralized Finance, or DeFi
Centralized entities, such as banks or stock exchanges, have been facilitating financial transactions for centuries. Progress in information technology and cryptography has unlocked new possibilities over the past few years. Decentralized finance, or DeFi, establishes a revolutionary way to conclude financial transactions by eliminating the need for centralized intermediaries (Harvey et al., 2021).
DeFi is powered by smart contracts. Smart contracts are digital contracts deployed on a blockchain as self-executing programs. The terms of the agreement are embedded in the program’s code and enforced via execution. Pre-defined contractual arrangements, and computerized enforcement eliminate any uncertainty about the outcome. Therefore, smart contracts allow counterparties to interact without a trusted intermediary. The most important smart contract platform is the Ethereum blockchain, whose native cryptocurrency, Ether (ETH), is currently the second-largest cryptocurrency by market capitalization.
Smart contracts are the backend component of decentralized applications, or dApps, and instruct how the application is intended to work. These applications are decentralized because their backend code, i.e., smart contracts, run on a peer-to-peer network rather than a centralized server. Furthermore, data is stored on the blockchain distributed ledger.
Decentralized finance is a growing movement of dApps that seek to reinvent the financial services industry. As smart contracts can reduce frictions and deliver more value to a broader set of users, they will replace the traditional financial infrastructure according to DeFi proponents (Harvey et al., 2021). DeFi apps can accommodate a wide range of financial needs: borrowing, lending, trading, investing, insurance and much more. In this section we will focus on dApps aimed at facilitating the exchange of cryptocurrencies between users, i.e., decentralized exchanges (DEXs).
3.2.2 Overview of decentralized exchanges
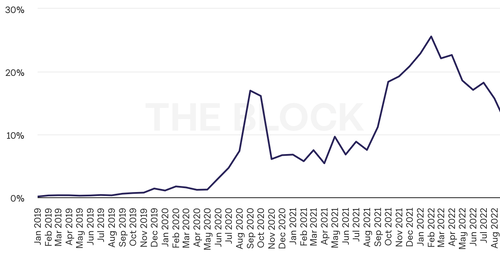
According to The Block website, accessed on 2022-09-16, $909.02 billion were traded on decentralized exchanges in the first eight months of 2022, showing a lower relevance of these trading venues as compared to centralized exchanges ($5.69 trillion). Figure 14 represents the monthly decentralized exchange volume divided by centralized exchange volume (as a percentage) from November 2018 to August 2022 (The Block website, accessed on 2022-09-16).
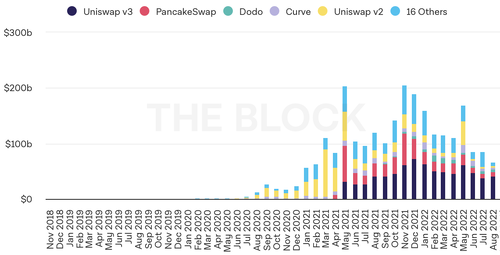
Decentralized exchanges represent an innovation as compared to the well-established CEX model. Decentralized exchanges began to to be widely adopted only in 2020 and 2021, and there may be room for a further increase in popularity in the future. Figure 15 shows the monthly spot trading volume on decentralized exchanges from November 2018 to August 2022 (The Block website, accessed on 2022-09-16). In the first eight month of 2022, DEX trading volumes followed the same declining path we have observed for centralized exchanges, as a result of the current “crypto winter”.
As we see in Figure 15, Uniswap is the largest decentralized exchange by trading volume. Uniswap markets will be analyzed in depth in what follows. There are three versions of the platform, the most recent update being Uniswap v3. For the sake of simplicity, in this document we will focus on the original implementation (Uniswap v1).
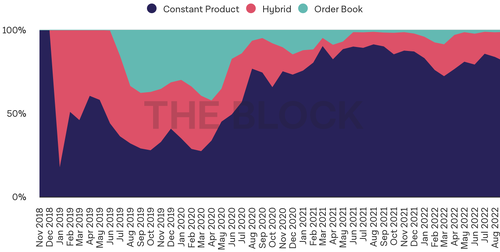
Uniswap is based on the constant product Automated Market Maker (AMM) technology instead of a LOB. Indeed, the constant product AMM is the dominant liquidity provision mechanism in the DEX space, as opposed to centralized exchanges that typically rely on a traditional limit order book. Figure 16 represents the share of the different DEX trading mechanisms from November 2018 to August 2022 (The Block website, accessed on 2022-09-16).
3.2.3 The basics of Automated Market Makers
In traditional finance, a market maker is an entity that systematically quotes bid and ask prices for an asset. The difference between these prices, called bid-ask spread, generates a profit for the market maker. Because market makers stands ready to buy or sell an asset, they provide liquidity to the market. An Automated Market Maker leverages on the smart contract technology to programmatically replicate the behavior of a traditional market maker. You can think of an Automated Market Maker as computer program, or a “vending machine”, that automates the process of providing liquidity.
Users willing to supply liquidity (liquidity providers) must deposit into the program the same dollar amount of two cryptos (Crypto X and Crypto Y). In turn, they receive liquidity tokens (a sort of quotas) proportionally to their contribution. Liquidity providers can withdraw their share of the pool buy burning the liquidity tokens.
Buyers and sellers trade against the computer program (i.e. the AMM), which executes orders according to a pre-defined pricing function that is built in its code. More specifically, the trade price algorithmically depends on the relative liquidity supply of Crypto X and Crypto Y, and on the traded quantity. Traders know ex-ante the market making function (everyone can access the code, which is public), so they can determine the exact execution price before submitting the order. Therefore, AMMs are very transparent. Traders pay fees to remunerate the liquidity providers.
For the sake of security, the AMM’s code is immutable, and cannot be altered even by its creator. However, this means that the AMM cannot be updated in case of bugs.
The liquidity pool
Our AMM manages swaps between Crypto X and Crypto Y. The AMM’s liquidity pool comprises two buckets, one containing Cryptos of type X and the other containing Cryptos of type Y. These buckets worth the same, i.e., Cryptos X worth exactly as Cryptos Y. Therefore, the price of Crypto X in terms of Crypto Y is given by . For example, if you have 100 Cryptos X and 1000 Cryptos Y, the price of Crypto X in terms of Crypto Y is 1000/100=10. As we are going to explain, this price is kept aligned with the general market price by no-arbitrage forces.
The price implied by the liquidity pool cannot be altered through liquidity provision. Thus, liquidity providers are required to follow the existing proportions when depositing Crypto X and Crypto Y in the liquidity pool (e.g. 1 Crypto X and 10 Cryptos Y). Put it differently, liquidity providers must contribute the same dollar amount of Crypto X and Crypto Y. Indeed, if liquidity provision altered the price implied by the pool, arbitrage opportunities would raise. Appendix A discusses the market making function in detail and compares the outcome of decentralized market making to the outcome of a standard limit order book.
A. Appendix
A.1 The market making function
As utility functions power economic models by describing consumers’ preferences, the AMM is powered by a function capable of replicating the behavior of a market maker. We decide to use a given function to describe utility because it has some desirable properties, e.g. its shape captures risk aversion. We decide to use a given function to describe the behavior of a market maker because it has some desirable properties, e.g. larger trades have a greater price impact. As there are many utility functions, there are also many market making functions. For example, Uniswap v1 adopts the constant product formula.
In absence of fees, the constant product formula is:
where:
is the amount of Crypto X inside the pool before a trade
is the amount of Crypto Y inside the pool before a trade
is the change of produced by a trade
is the change of produced by a trade
Suppose that Alice wants to trade units of Crypto X in exchange for cryptos of type Y. is known, as it is specified in Alice’s order. Furthermore, and (the amounts of the two cryptos inside the pool before the trade) can be observed. The equation has only one unknown, , which represents the number of cryptos of type Y the AMM will return Alice in exchange for units of Crypto X.
Therefore, if we solve the constant product formula for , we obtain:
Notice that, since Alice sells Crypto X in exchange for Crypto Y, is positive (the amount of Crypto X in the pool increases with the trade), while is negative (the amount of Crypto Y in the pool decreases with the trade).
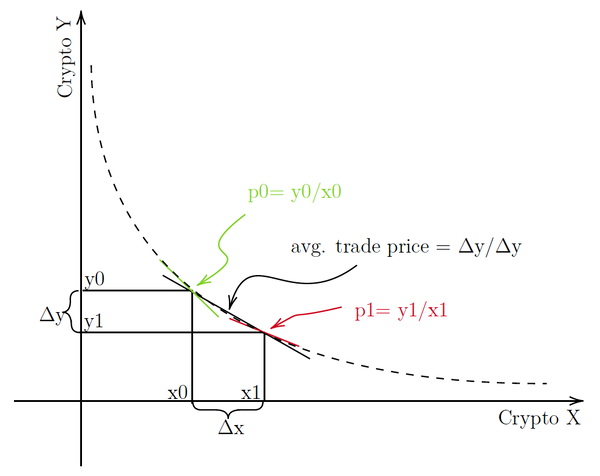
The average price of Crypto X in terms of Crypto Y paid by Alice is:
Notice that the infinitesimal trade (i.e. a trade whose volume is infinitely small) takes place exactly at :
A non-infinitesimal trade moves the price of Crypto X in terms of Crypto Y from to :
Graphically:
Let’s now make things a bit more complex and introduce fees. Recall that traders pay fees to remunerate the liquidity providers. Notice that fees are paid using the crypto you sell. Let’s define .
If you are selling Crypto X:
If you are buying Crypto X:
A.2 AMM-LOB relationship
Starting from the market making function, it is possible to derive the relationship between the traded quantity and the price of an asset in Uniswap v1. To simplify the math, we assume no fees.
In a constant product AMM (with no fees), the product between the amount of Crypto X () and the amount of Crypto Y () in the liquidity pool must always be the same and should not be altered by trades (see Appendix A.1):
[1]
where:
is the amount of Crypto X inside the pool before a trade takes place
is the amount of Crypto Y inside the pool before a trade takes place
is the change of produced by a trade
is the change of produced by a trade
If we solve the constant product formula [1] for , we obtain
[2]
We define the amount of Crypto X () and Crypto Y () after a trade as
[3]
[4]
We substitute the formula for [2] inside equation [4]
[5]
The price of Crypto X in terms of Crypto Y () is
[6]
The new price of Crypto X in terms of Crypto Y () after a trade is
[7]
We substitute the formulas for [3] and [5] inside the previous equation [7]
[8]
We define as the percentage change of the price of Crypto X in terms of Crypto Y produced by a trade
[9]
We substitute the formulas for [6] and [8] inside the previous equation [9]
[10]
We solve equation [10] for (i.e. the quantity of Crypto X which is traded)
[11]
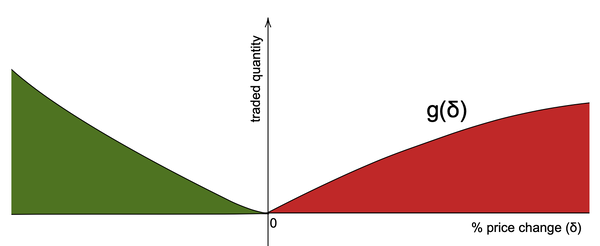
Therefore, the relationship between the absolute traded quantity of Crypto X and the consequent percentage change in the price of Crypto X is
[12]
Graphically:
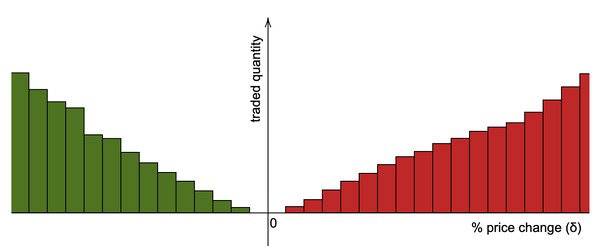
Notice that this relationship is very similar to what we observe in a traditional Limit Order Book market:
Notice that, while in LOB markets the relationship between the traded quantity and the percentage change in the price of an asset is discrete, in Uniswap v1 it is continuous.
Notes
- ↑ You interact with this architecture every times you visit a web page. To visit a web page you must install a web browser, e.g. Google Chrome, on your PC. Google Chrome is a client software. When you visit a website, e.g. www.wikipedia.org, Google Chrome sends a requests to a web server that returns the desired web page.
- ↑ To run a node appropriate software must be installed.
- ↑ The concept of proof-of-work was introduced in the ’90s to deter abuses on a network, such as spam. Sending an e-mail is not costly, and therefore spammers can freely send thousands, or even millions, of e-mails to their victims. To avoid this, you can require senders to do some computational work (e.g., solving a mathematical puzzle) before being able to send an e-mail. In this way, you overwhelm spammers with a significant computational burden, thus hampering their activity (Dwork and Naor, 1992).
- ↑ The hexadecimal number system is a number system in base 16, i.e. it uses 16 symbols instead of the 10 adopted by the decimal number system. These symbols are
0,1,2,3,4,5,6,7,8,9,a,b,c,d,e,f. The private key reported in the example in decimal format is: 26563230048437957592232553826663696440606756685920117476832299673293013768870. - ↑ Know-your-customer/anti-money laundering policies, trading rules and market surveillance, country risk, financial regulation, insurance coverage.
- ↑ In the following we will analize the market microstructure of centralized spot exchanges for cryptocurrencies. For each topic (e.g. order type and options, trading parameters, fee schedule...) we sourced information about 10 exchanges (Coinbase, Binance, Kraken, FTX US, Gemini, ItBit, Bitstamp, CEX.IO, FTX, Huobi) from the respective technical and support documentation. Our references are: Coinbase support website, accessed on 2022-09-19; Coinbase support website, accessed on 2022-09-19; Coinbase API docs, accessed on 2022-09-19; Binance support website, accessed on 2022-09-19; Binance API docs, accessed on 2022-09-19; Kraken support website, accessed on 202209-19; Kraken REST API docs, accessed on 2022-09-19; Kraken Websockets API docs, accessed on 2022-09-19; FTX US support website, accessed on 2022-09-19; FTX US API docs, accessed on 2022-09-19; Gemini support website, accessed on 2022-09-19; Gemini REST API docs, accessed on 2022-09-19; Gemini Websockets API docs, accessed on 2022-09-19; Paxos support website, accessed on 2022-09-19; Paxos REST API docs, accessed on 2022-09-19; Bitstamp support website, accessed on 2022-09-19; Bitstamp API docs, accessed on 2022-09-19; CEX.IO support website, accessed on 2022-09-19; CEX.IO API docs, accessed on 2022-09-19; FTX support website, accessed on 2022-0919; FTX API docs, accessed on 2022-09-19; Huobi support website, accessed on 2022-09-19; Huobi API docs, accessed on 2022-09-19.
References
- Acheson, Noelle. (2022). Hard fork vs. soft fork. https://www.coindesk.com/learn/hard-fork-vs-soft-fork/
- Aleti, S., & Mizrach, B. (2021). Bitcoin spot and futures market microstructure. Journal of Futures Markets, 41(2), 194–225.
- Antonopoulos, A. M. (2017). Mastering bitcoin: Programming the open blockchain (2nd). O’Reilly Media, Inc.
- Antonopoulos, Andreas M. (2018). Bitcoin q&a: Orphaned blocks and stuck transactions. https://www.youtube.com/watch?v=MsdW0CTYwyY
- Binance academy. (2022). Hards forks and soft forks explained. https://academy.binance.com/en/articles/hard-forks-and-soft-forks
- Binance API docs. (accessed on 2022-09-19). https://binance-docs.github.io/apidocs/spot/en/#change-log
- Binance support website. (accessed on 2022-09-19). https://www.binance.com/en/support/faq/c-3?navId=3#15
- Bitcoin website. (accessed on 2022-08-17). https://bitcoin.org/en/
- Bitstamp API docs. (accessed on 2022-09-19). https://www.bitstamp.net/api/
- Bitstamp support website. (accessed on 2022-09-19). https://www.bitstamp.net/faq/
- Blockchain.com. (accessed on 2022-09-26). https://www.blockchain.com
- CEX.IO API docs. (accessed on 2022-09-19). https://docs.cex.io/?_gl=1*1rd4zcx*_ga*MTAwNzQ1MTY5NS4xNjYzMTQyNDU4*_ga_QF933RX2RP*MTY2MzU5ODE0Ny4#cex-io-api-introduction
- CEX.IO support website. (accessed on 2022-09-19). https://support.cex.io/en/
- Coinbase API docs. (accessed on 2022-09-19). https://docs.cloud.coinbase.com/exchange/docs
- Coinbase support website. (accessed on 2022-09-19). https://help.coinbase.com/en
- CoinMarketCap. (accessed on 2022-09-12). Cryptocurrencies. https://coinmarketcap.com
- CoinMarketCap. (accessed on 2022-09-01). Top cryptocurrency spot exchanges. https://coinmarketcap.com/rankings/exchanges/
- Cong, L. W., Li, X., Tang, K., & Yang, Y. (2021). Crypto wash trading. arXiv preprint arXiv:2108.10984.
- CryptoCompare API. (data downloaded on 2022-09-01). Exchange histoday. https://min-api.cryptocompare.com
- CryptoCompare API. (data downloaded on 2022-09-13). Top mktcapfull. https://min-api.cryptocompare.com
- Decker, C., & Wattenhofer, R. (2013). Information propagation in the bitcoin network. IEEE P2P 2013 Proceedings, 1–10.
- Dwork, C., & Naor, M. (1992). Pricing via processing or combatting junk mail. Annual international cryptology conference, 139–147.
- Ethereum website. (accessed on 2022-08-17). https://ethereum.org/en/
- FTX API docs. (accessed on 2022-09-19). https://docs.ftx.com/#overview
- FTX support website. (accessed on 2022-09-19). https://help.ftx.com/hc/en-us
- FTX US API docs. (accessed on 2022-09-19). https://docs.ftx.us/#overview
- FTX US support website. (accessed on 2022-09-19). https://help.ftx.us/hc/en-us
- Garavaglia, R. (2022). Conoscere la blockchain for dummies. John Wiley & Sons.
- Gemini REST API docs. (accessed on 2022-09-19). https://docs.gemini.com/rest-api/ Gemini support website. (accessed on 2022-09-19). https://support.gemini.com/hc/en-us
- Gemini Websockets API docs. (accessed on 2022-09-19). https://docs.gemini.com/websocket-api/
- Harvey, C. R., Ramachandran, A., & Santoro, J. (2021). Defi and the future of finance. John Wiley & Sons.
- Huobi API docs. (accessed on 2022-09-19). https://huobiapi.github.io/docs/spot/v1/en/#change-log
- Huobi support website. (accessed on 2022-09-19). https://www.huobi.com/support/en-us/list/360000010312
- Kaiko Indices. (2022). Kaiko exchange ranking rulebook. https://marketing.kaiko.com/hubfs/Factsheets/Kaiko%5C%20Exchange%5C%20Ranking%5C%20Rulebook%5C%20-%5C%20Light%5C%20public%5C%20version%5C% 20v2.docx%5C%20(1).pdf
- Kaiko website. (accessed on 2022-08-30). Kaiko exchange ranking. https://www.kaiko.com/pages/exchange-ranking
- Kent, P., & Bain, T. (2022). Cryptocurrency mining for dummies. John Wiley & Sons.
- Kraken REST API docs. (accessed on 2022-09-19). https://docs.kraken.com/rest/ #section/General-Usage
- Kraken support website. (accessed on 2022-09-19). https://support.kraken.com/hc/en-us/categories/200187143-Trading
- Kraken Websockets API docs. (accessed on 2022-09-19). https://docs.kraken.com/ websockets/
- Nakamoto, S. (2008). Bitcoin: A peer-to-peer electronic cash system. (accessed: 2022-08-17). https://bitcoin.org/bitcoin.pdf
- Paxos REST API docs. (accessed on 2022-09-19). https://developer.paxos.com/docs/v2/api
- Paxos support website. (accessed on 2022-09-19). https://help.paxos.com/hc/en-us/sections/360008512152-Trading-and-Funding
- Securities Industry and Financial Markets Association. (2022). 2022 capital markets fact book. https://www.sifma.org/wp-content/uploads/2022/07/CM-Fact-Book-2022-SIFMA.pdf
- S&P Dow Jones Indices website. (accessed on 2022-09-13). S&p cryptocurrency broad digital market index. https://www.spglobal.com/spdji/en/indices/digital-assets/sp-cryptocurrency-broad-digital-market-index/#overview
- The Block website. (accessed on 2022-09-01). The block legitimate index. https://www.theblock.co/data/crypto-markets/spot
- The Block website. (accessed on 2022-09-16). Defi exchange. https://www.theblock.co/data/decentralized-finance/dex-non-custodial
- Wikipedia. (accessed on 2022-09-23). https://en.wikipedia.org/wiki/Fork_(blockchain)
